What is a B2C Market Research Survey?
A B2C survey targets the general public or end-users who purchase products or services. These surveys usually focus on experiences such as satisfaction, service quality, or likelihood to recommend. Feedback is often collected at the point of sale or after delivery and is directed toward the person making the final buying decision, which may involve impulse purchases, habitual buying, or complex one-time decisions like purchasing a home.
What is a B2B Survey?
A B2B survey targets business professionals across industries and roles. These surveys may gauge interest in products or services or collect feedback to improve offerings. B2B research often involves multiple stakeholders within the same organization, including executives, finance, IT, and daily users. Capturing insights from these different roles is critical, as perspectives can vary significantly depending on responsibilities and decision-making authority.
A strong research design is essential for structuring B2B surveys so the data collected is actionable and relevant.
Understanding the Target Audience
Understanding the target audience is central to effective market research. Knowing who respondents are, what motivates them, and how they make decisions enables researchers to design surveys that generate meaningful insights.
B2B Market Research: Reaching Business Professionals
B2B research focuses on decision-makers and professionals with specialized knowledge. Surveys must be highly targeted and role-specific to capture insights that directly inform business strategy. Researchers often use a mix of online surveys, interviews, and focus groups to engage these high-value respondents.
B2C Market Research: Understanding Consumer Behavior
B2C research focuses on individual consumers and their preferences, purchasing behavior, and experiences. Surveys are designed to reach large and diverse audiences to uncover trends, identify issues, and improve marketing and customer experience strategies.
Survey Recruitment and Response Rates in B2B Research
B2B surveys require targeted recruitment, often involving follow-ups and multiple contact attempts. Response rates tend to be lower due to time constraints and survey complexity, so the emphasis is placed on data quality rather than volume.
Sample Size and Representation in B2C Surveys
B2C surveys typically rely on larger sample sizes to ensure representativeness. These datasets allow researchers to identify patterns in attitudes and behavior that inform product development and marketing initiatives.
Why Audience Understanding Drives Better Insights
Recognizing the differences between business professionals and individual consumers allows researchers to design surveys that uncover meaningful feedback, reveal market trends, and support confident decision-making.
7 Differences Between B2B & B2C Surveys
Methodology
B2C surveys can use a wide range of methods, including online surveys, interviews, and focus groups. B2B surveys often require a mix of approaches, such as panels, follow-up emails, phone calls, or in-person interviews, due to smaller and more time-constrained audiences.
Response Rates
B2C surveys can be distributed widely, resulting in higher response rates. B2B surveys target specific roles within organizations, which limits distribution and lowers response rates. B2B surveys are also more complex and time-consuming, contributing to drop-offs.
Sample Sizes
B2C research typically has access to large respondent pools, while B2B research operates with smaller, more specialized samples. As a result, B2B data is often analyzed without heavy weighting and focuses on influential respondents.
“Fun” Factor
B2C surveys tend to be more emotionally driven and visually engaging, while B2B surveys are more rational and data-focused. That said, adding visuals or interactive elements like picture questions can improve engagement for both audiences.
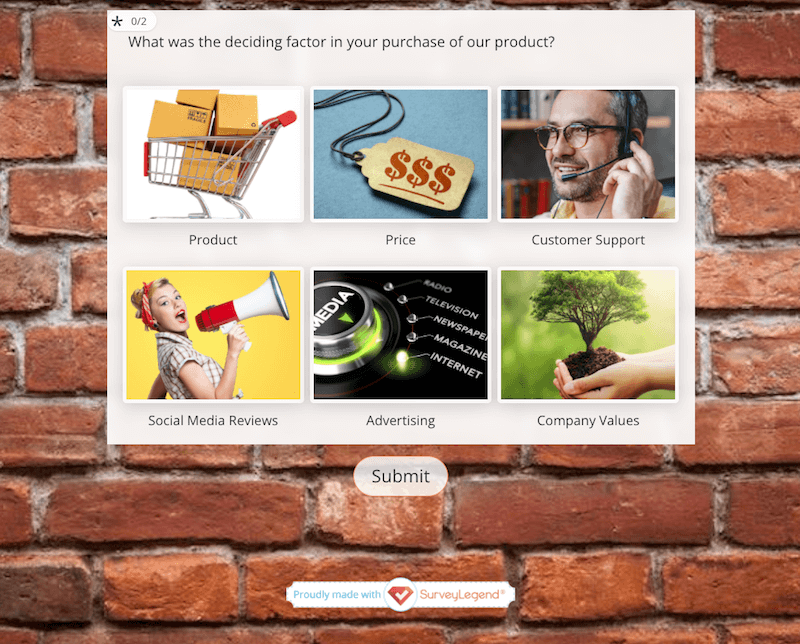 Learn more about SurveyLegend’s image-based surveys.
Rewards
In B2C market research, survey incentives are generally pretty straightforward, involving discounts, gifts, and gift cards or cash (in fact, the NCBI reports that in one study, a monetary incentive doubled the odds of participants returning a questionnaire). In B2B market research, incentives generally favor the business rather than the individual who is completing the survey. Typical B2B incentives include access to a report or whitepaper, a free demo, a webinar, or exclusive deals.
Cost
What’s the difference in cost between B2C & B2B surveys? It’s hard to say; it will depend on the number of surveys you send and the surveying method you choose. B2C surveys can be conducted with, potentially, millions of people. Of course, that could cost a fortune if you’re employing interviewers or telemarketers, paying for postage, and offering incentives. B2B surveys, on the other hand, are limited in scope with a smaller number of potential respondents. Therefore, they typically cost less due to the smaller sample size. However, B2B surveys may require additional follow-up in order to gather a representative response, costing additional time and money. So, always be sure to plan for the cost of your surveys to make sure you can achieve the results you want within the budget you have. Thankfully, online surveys cost little to nothing to send!
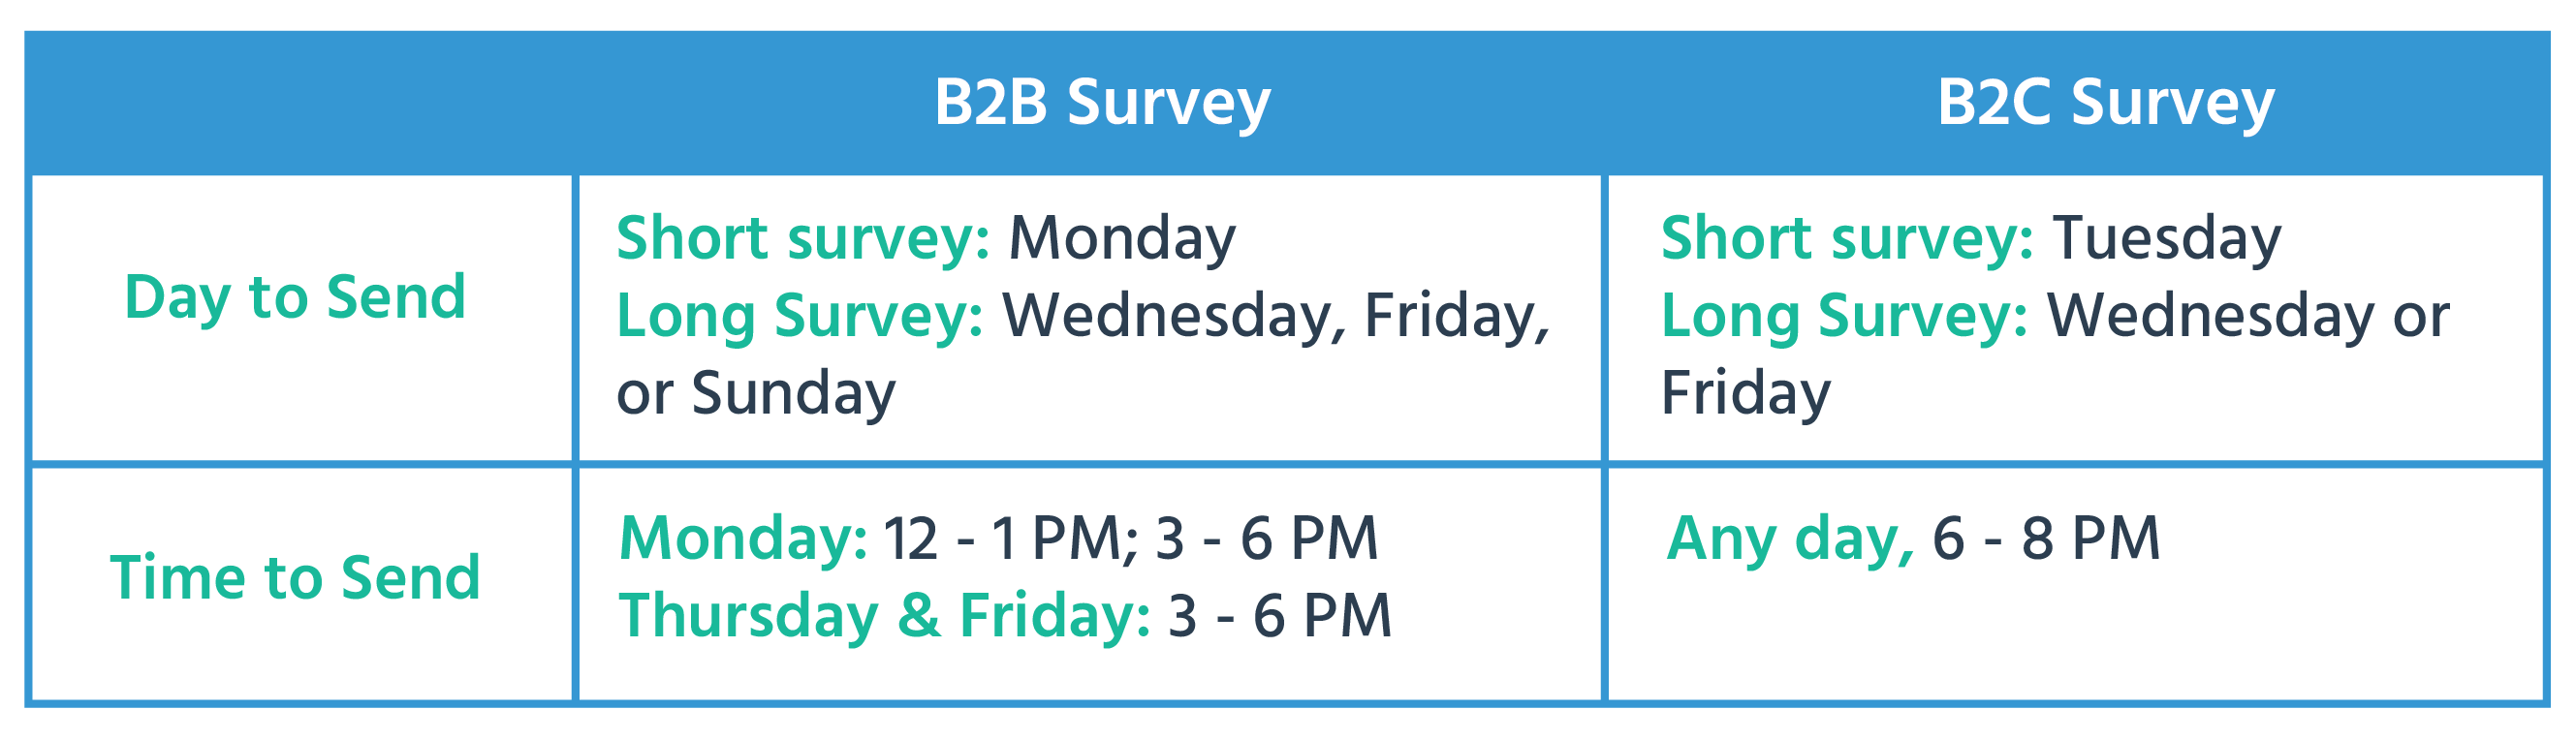
Timing
Don’t take a one-size-fits-all approach to sending B2C and B2B surveys online. Research shows that consumers and businesspeople have different email-opening habits. That means the day and time you send them should reflect this. A study from CheckMarket recognizes the difference between B2B and B2C audiences, as well as the length of the survey (short surveys being 15 minutes or less and long surveys being anything more than that). So, consider using this chart as a guide for sending surveys on the right day and time.
Conclusion
The concept of a one-size-fits-all approach will usually not work when it comes to B2C and B2B surveys. In most cases, methodologies, sample sizes, response rates, costs, timing, design, and incentives will be quite different. So, you’ll want to design surveys that reflect this. Ready to begin? SurveyLegend is your go-to B2C and B2B survey company! We offer a variety of types and styles of surveys, beautifully rendered photo surveys and picture polls, and a high level of security, along with real-time analytics that will give you an insane amount of insight. You can check out some of our B2C and B2B survey templates, or just get started for free now!
Frequently Asked Questions (FAQs)
A B2C or business-to-consumer survey targets the general public, and researchers tailor it to various demographics. A B2B or business-to-business survey targets business professionals, and researchers tailor it to industry, company size, job title, and so on.
Typical differences include methodology (how to conduct the survey), response rates, sample sizes, cost, timing, design, and inclusion of incentives.
B2C and B2B survey response rates vary depending on sample size and type of survey. However, the average survey rate across all is between 10% and 30%. Expect B2B surveys to garner fewer responses than B2C surveys